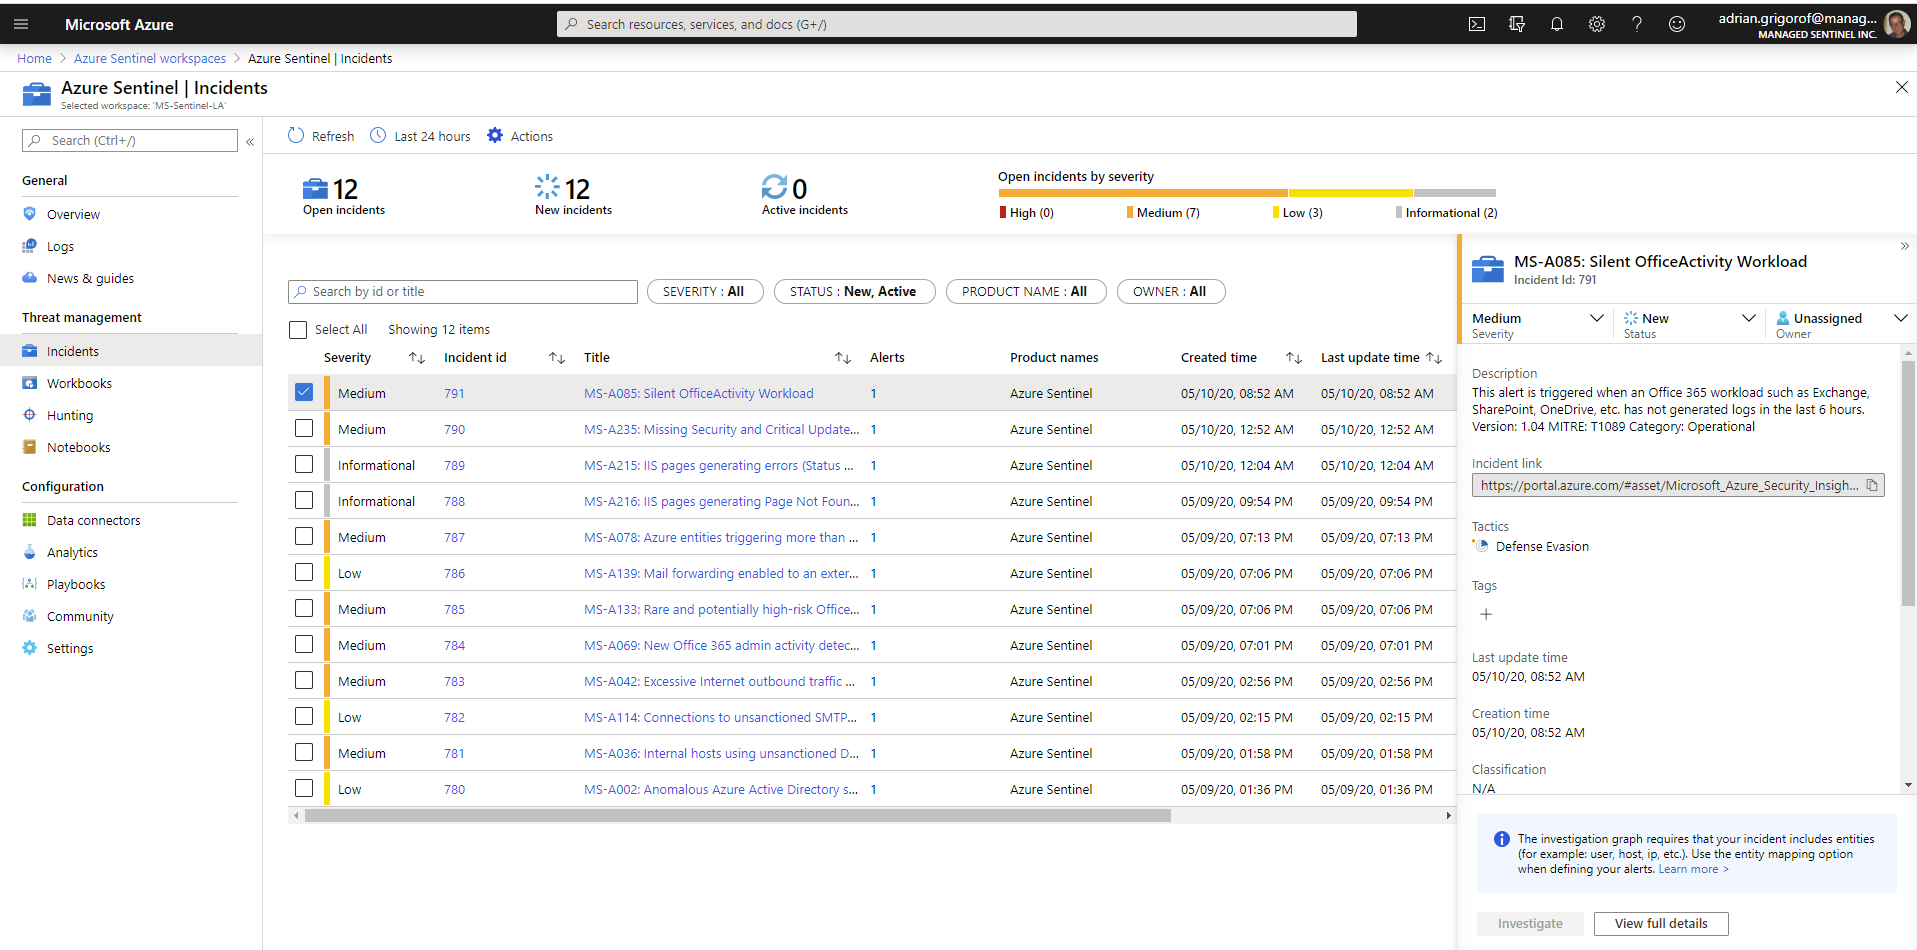
Since its release in preview mode in February 2019, Azure Sentinel has provided the Incidents blade in its portal as a platform to monitor and manage the situation when the configured use cases (alerts) are triggered. As the product evolved in bounds and leaps, the Incidents features has become more mature and now, combined with the advanced SOAR capabilities provided by Sentinel, it can be used as the sole incident management platform.
Incidents also happen to be the source of information for many types of information that senior management wants to see. While technical details on the nature of incidents are very important for the security analyst, there are other, less obvious ones that are of interests for the managers that need to provide the proper governance of the information security office. What managers need are measurable indicators of the incident response (IR) process. These indicators can assist in determining the efficiency of the IR team and point to ways to improve it.
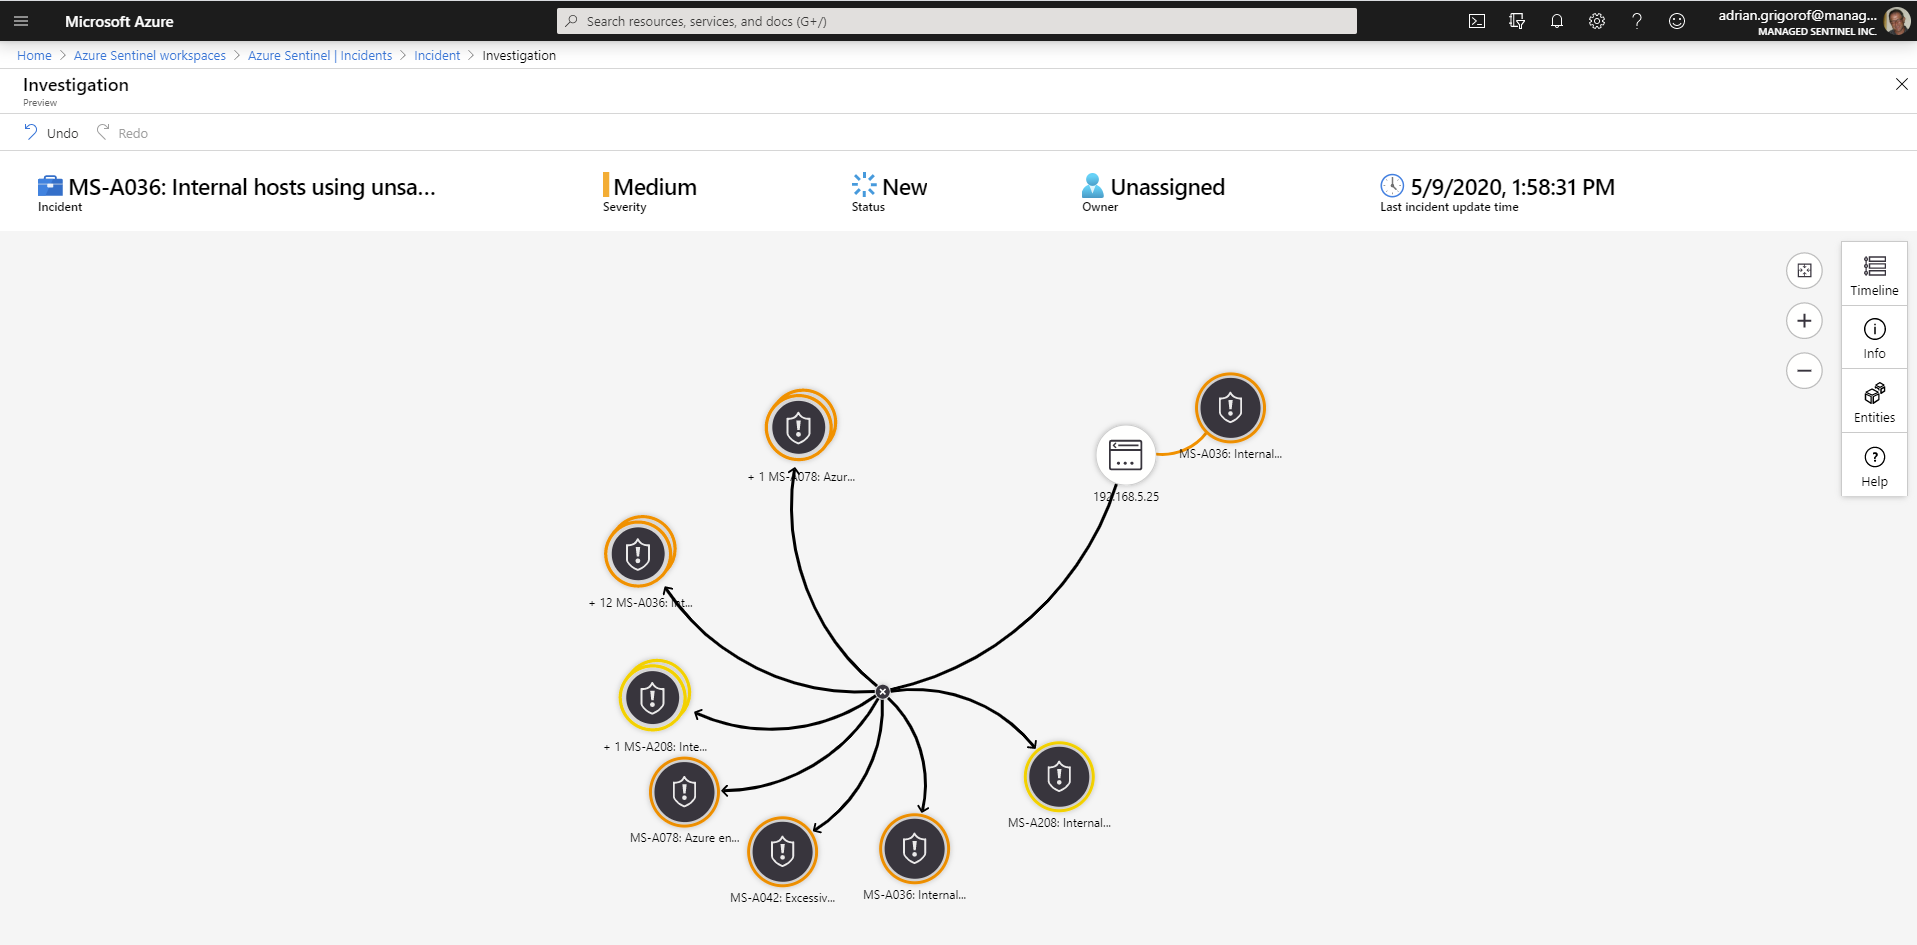
Azure Sentinel provides quite a rich Incidents interface but it is currently geared towards the analyst, with the ability to quickly drill into more details, correlate the alerts with other related incidents and manage the incident through its lifecycle.
These are great tools for the security analyst, but they leave out the typical summary and KPIs that an executive dashboard would require.
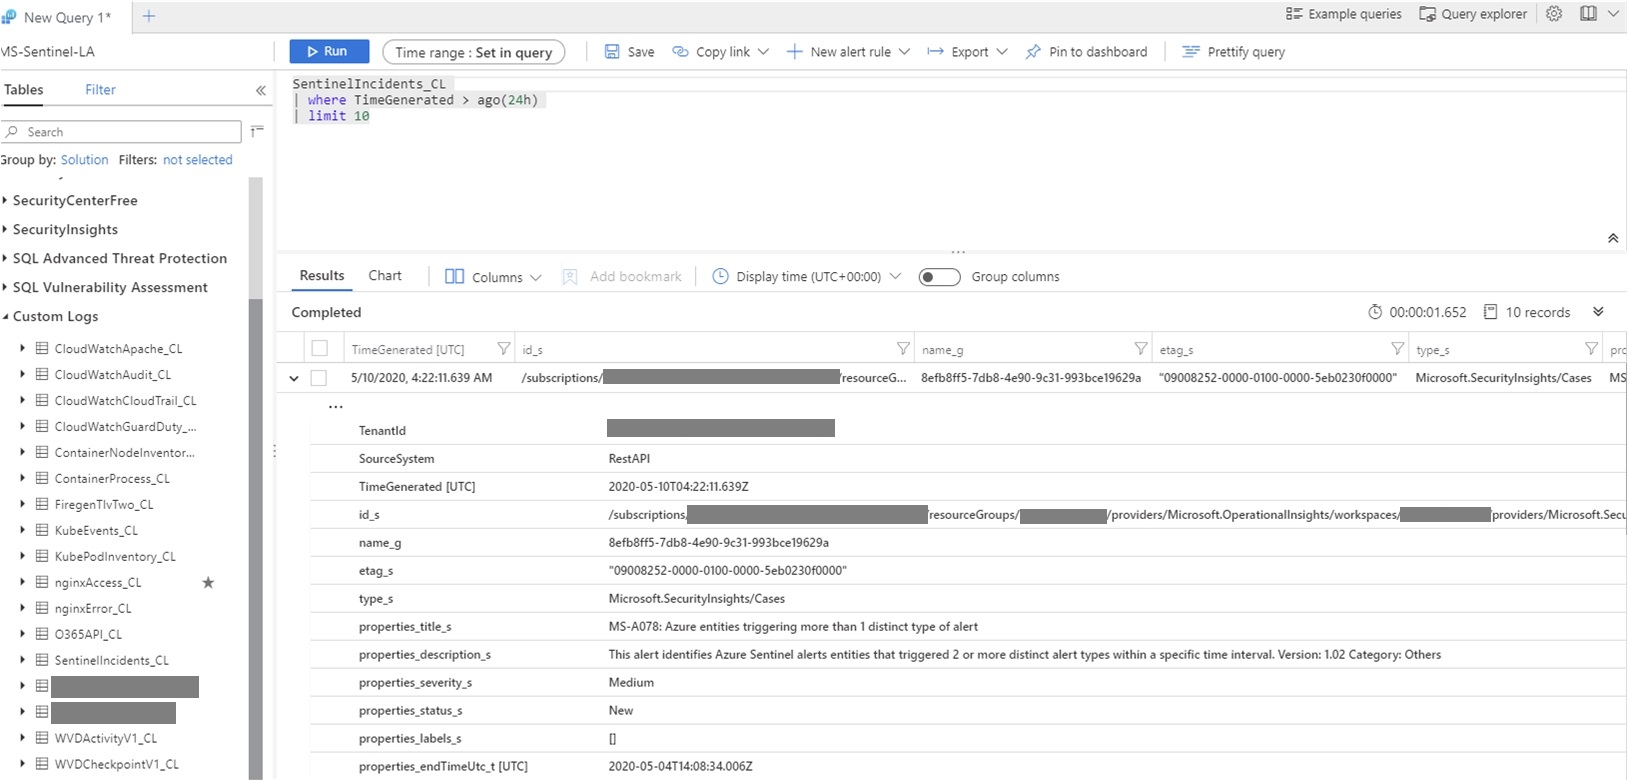
While the alert details are all captured in the SecurityAlert Sentinel table, the incidents themselves are not readily available as a table that can be queried and used to populate a Sentinel dashboard. As of today (May 10th, 2020), the Sentinel incident details are accessible through the Sentinel REST API, still in preview mode. In the API, the incidents are called “Cases” and one can retrieve all the incident details with the right REST API query.
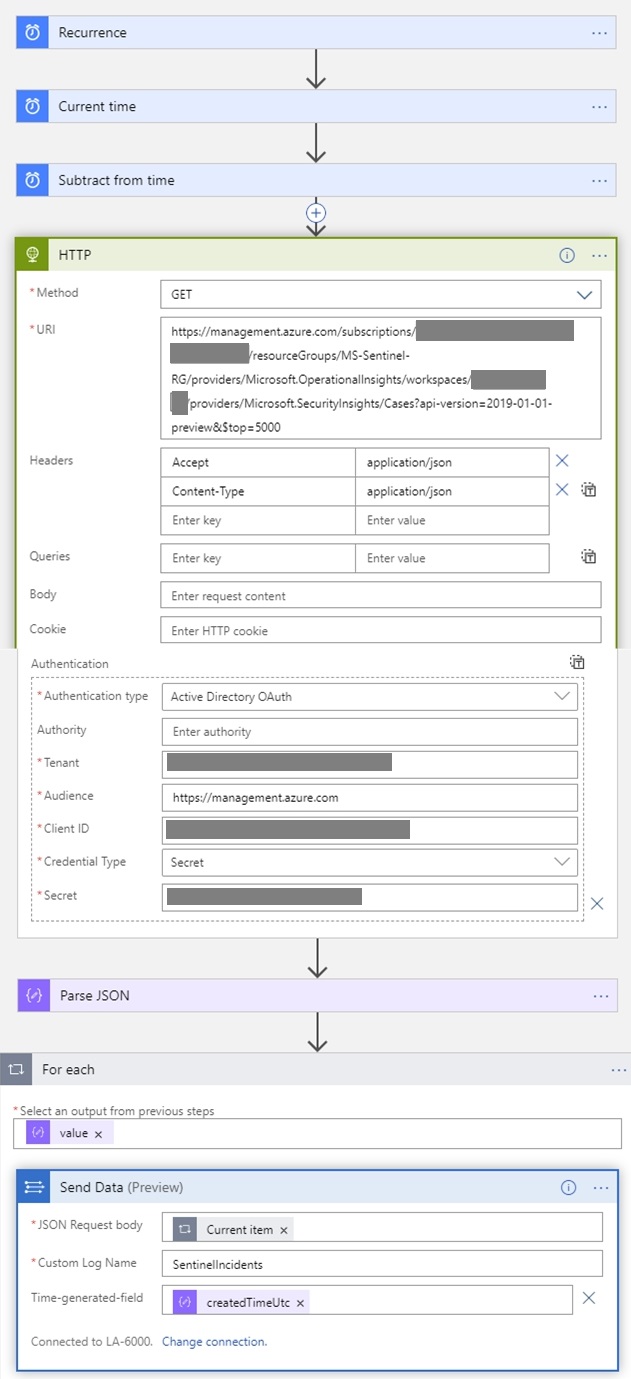
Given the ease with which Sentinel can ingest data through a REST API, we built a “recurrence” playbook that is able to retrieve the incidents at regular intervals (once per day in our case) and store them in the Sentinel Log Analytic workspace as a custom log.
As one can guess from the playbook actions, the API request is retrieving the whole list of incidents as a JSON file that is parsed, iterated and sent to Log Analytics as a custom log called SentinelIncidents.
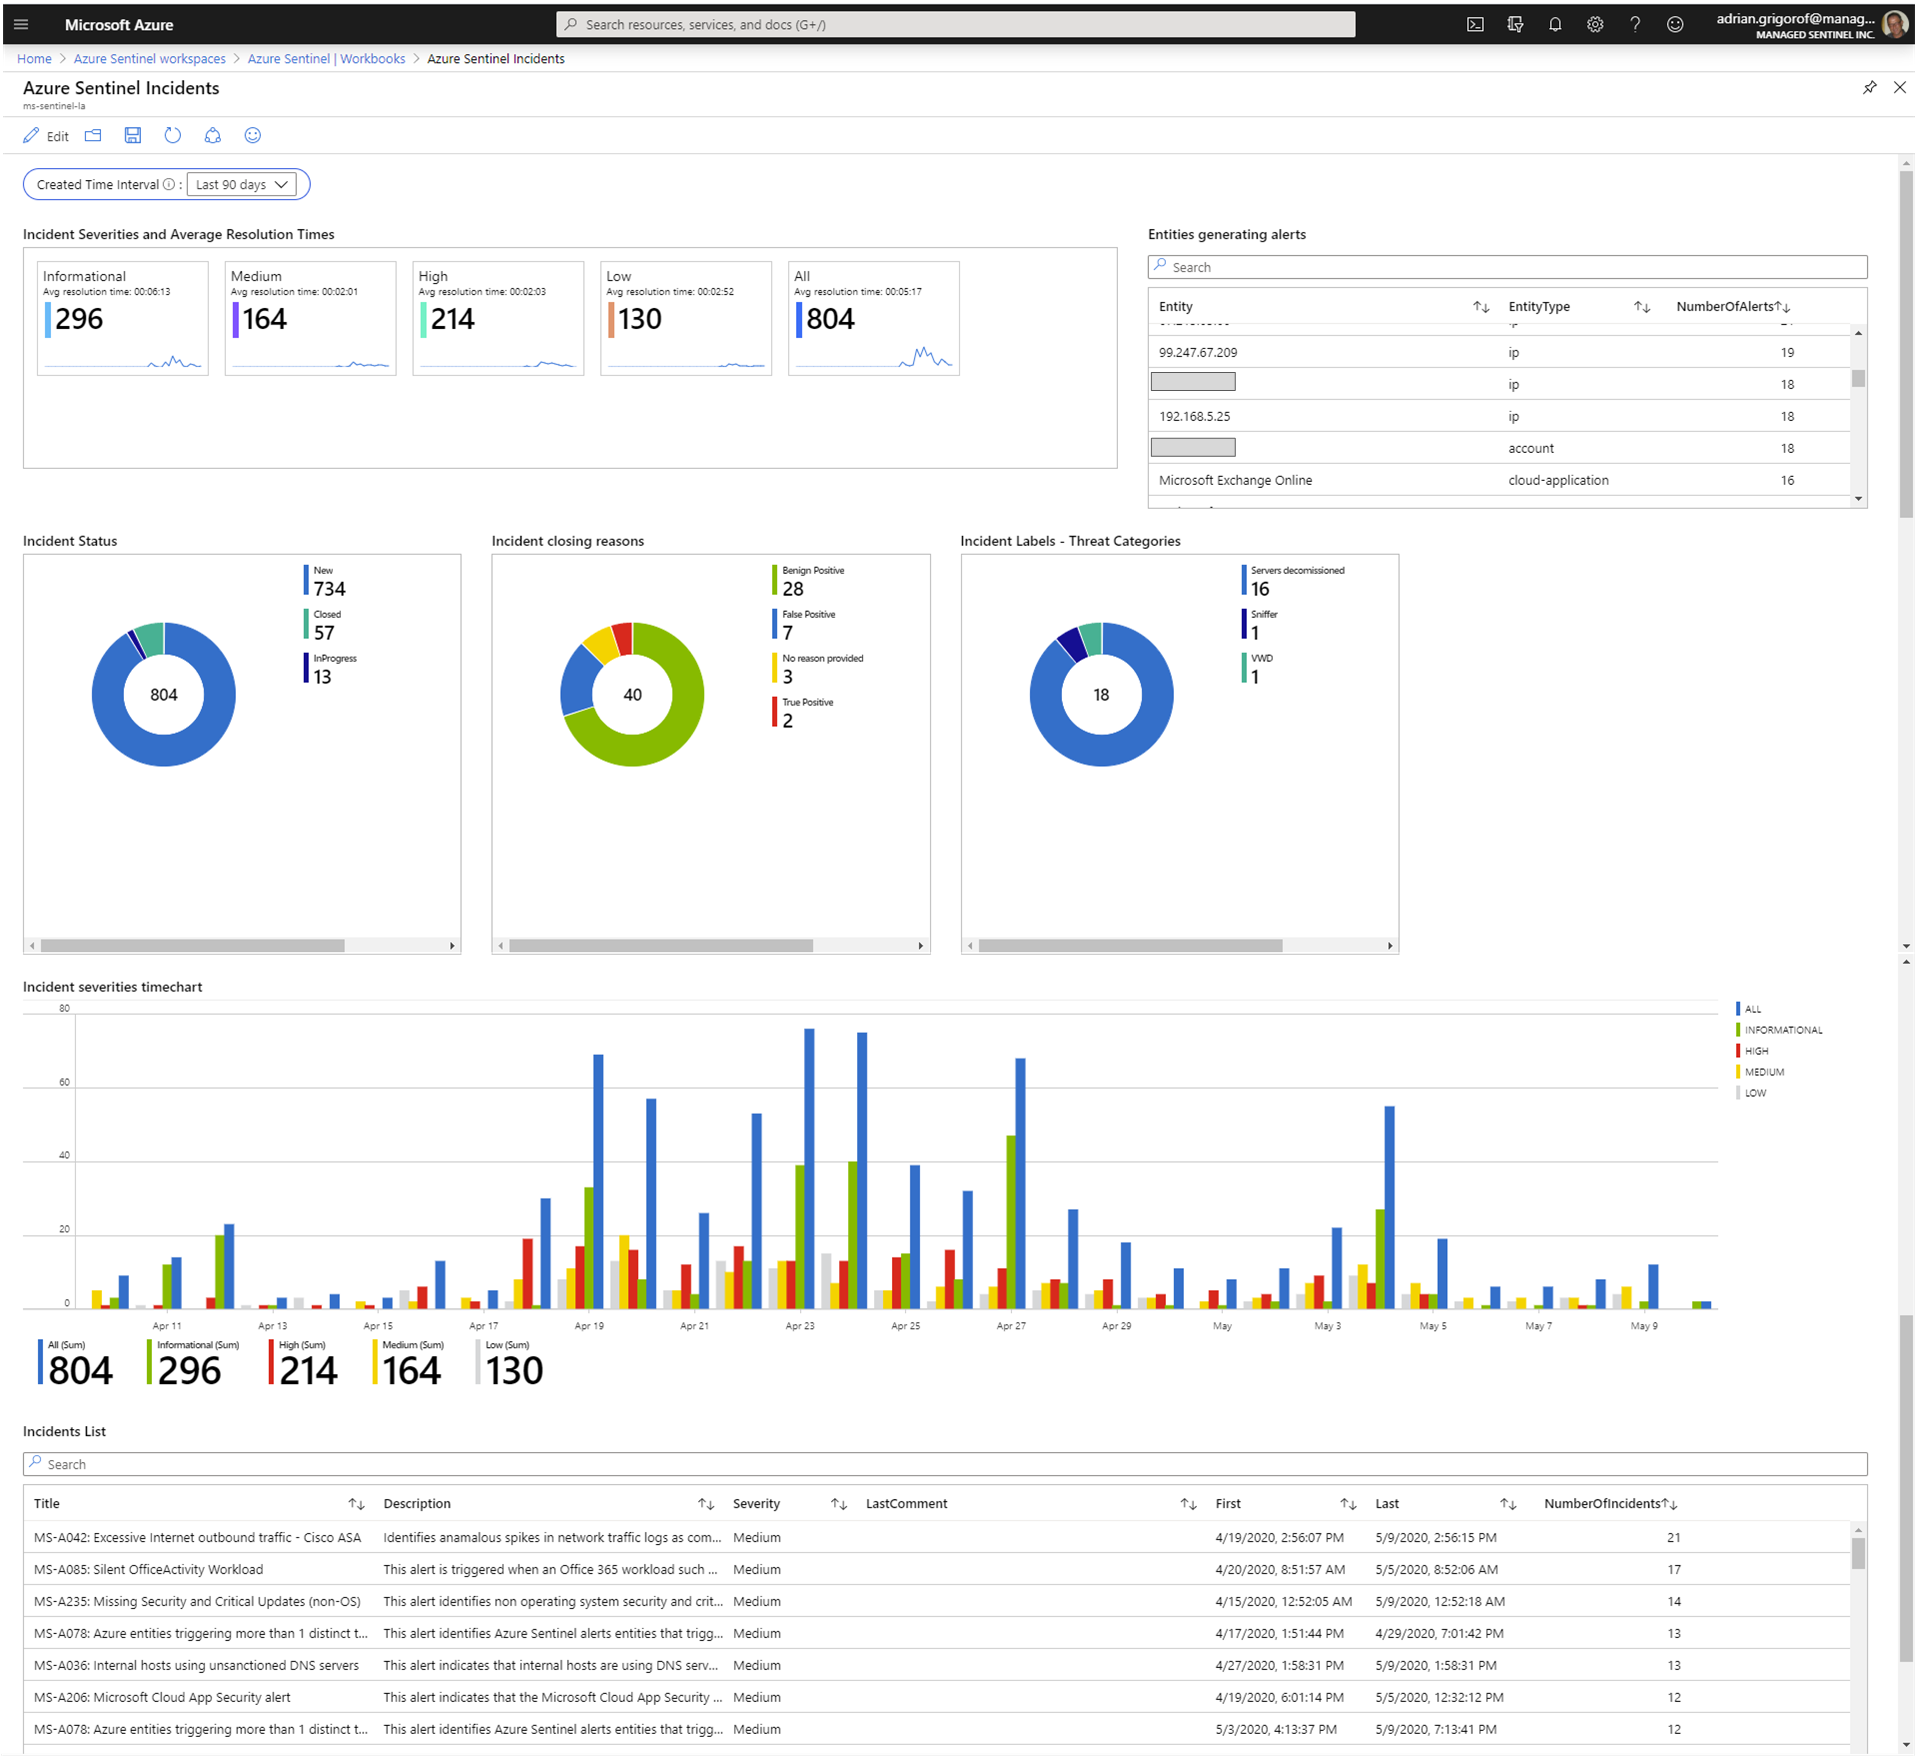
With the data stored as a custom log, the only limitation is just the ability to formulate the requirements and some internal convention on incidents tags and comments that can be used as ways to store and retrieve additional incident metadata that is not provided by Azure Sentinel out-of-the-box. For example, one can use the tags as “threat detail”. If the Azure Sentinel Incidents are used as the choice platform for incident response, a custom workbook can be built to capture the KPIs that an executive might expect. The workbook can combine data from the SecurityAlert and SecurityIncidents_CL tables:
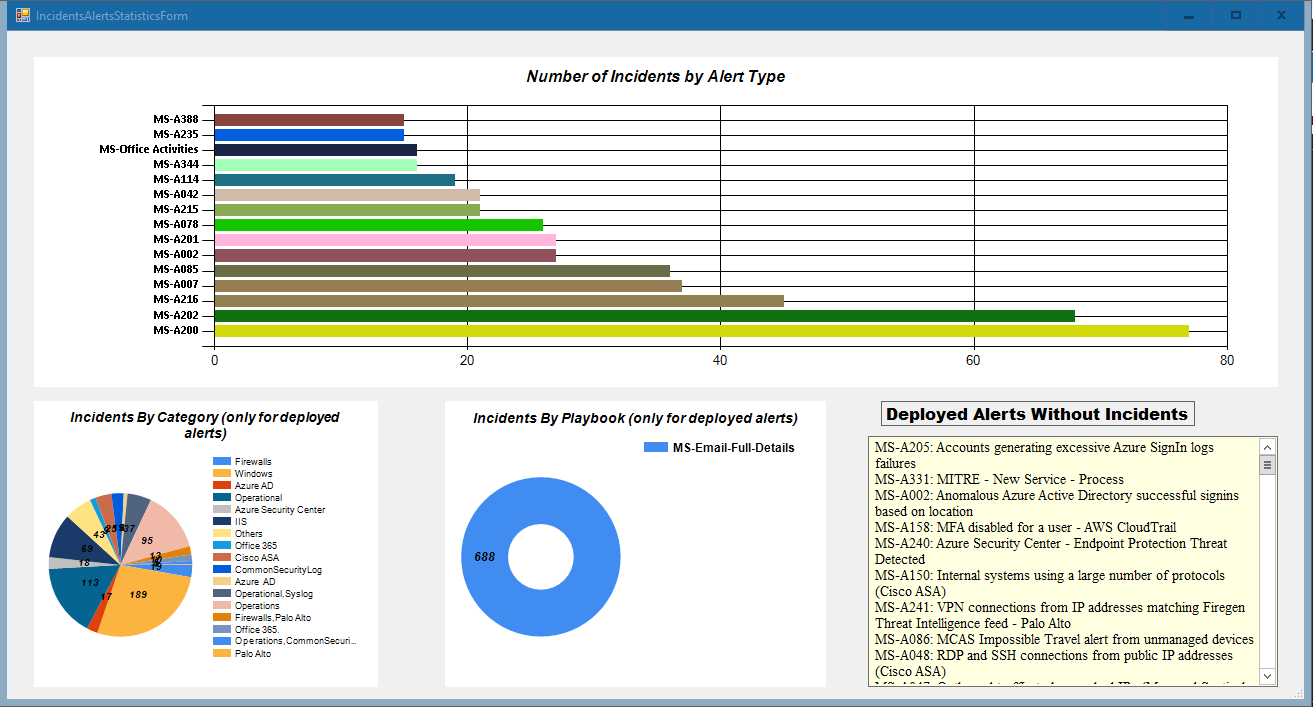
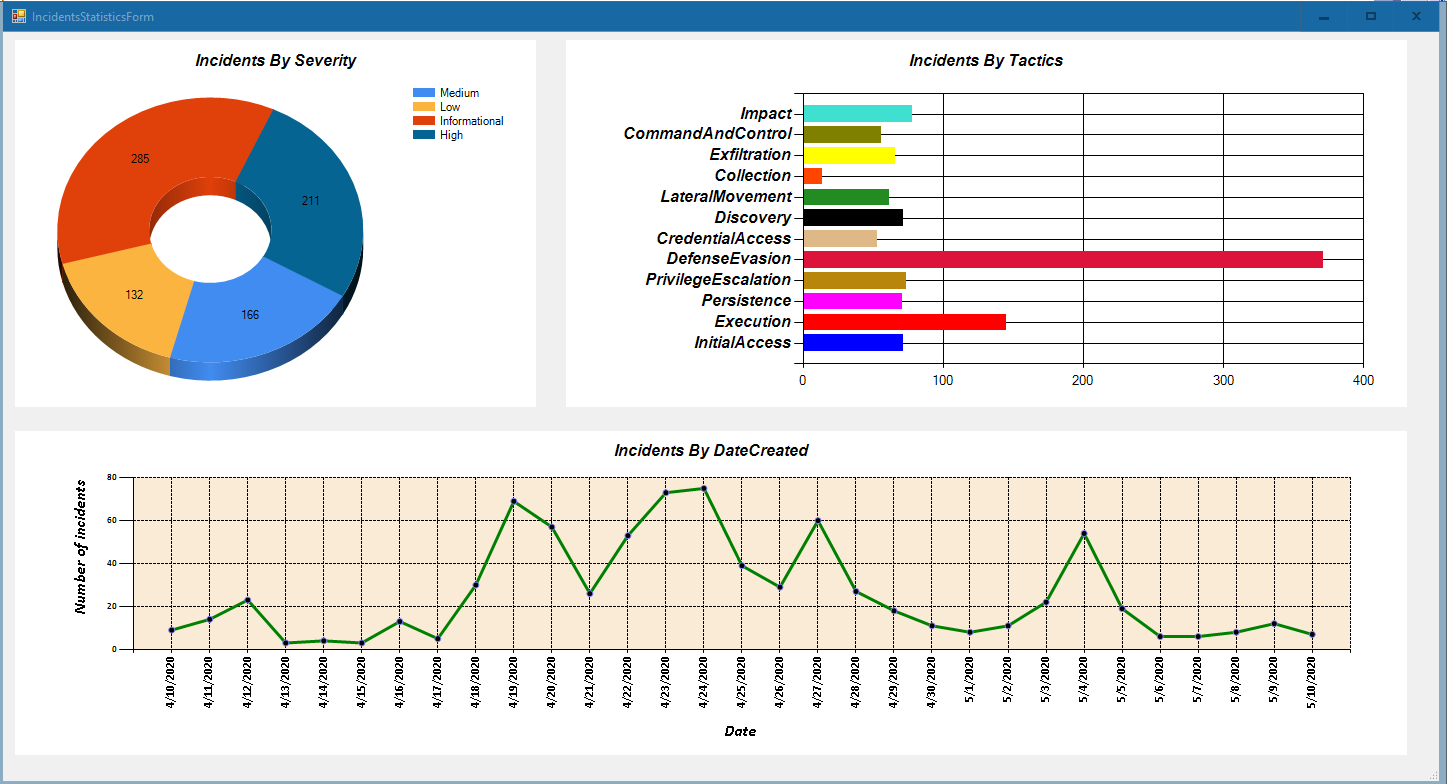
In addition to the Sentinel capabilities around dashboards/workbooks, the availability of incident data through the REST API can be used to integrate with other analytical platforms or build custom ones that can provide a more customized reporting capability. For example, our own custom-built Azure Sentinel management tool (ASM) can correlate our list of standard Sentinel alert templates with the Sentinel incidents to provide a view on the type of log sources vs. incidents:
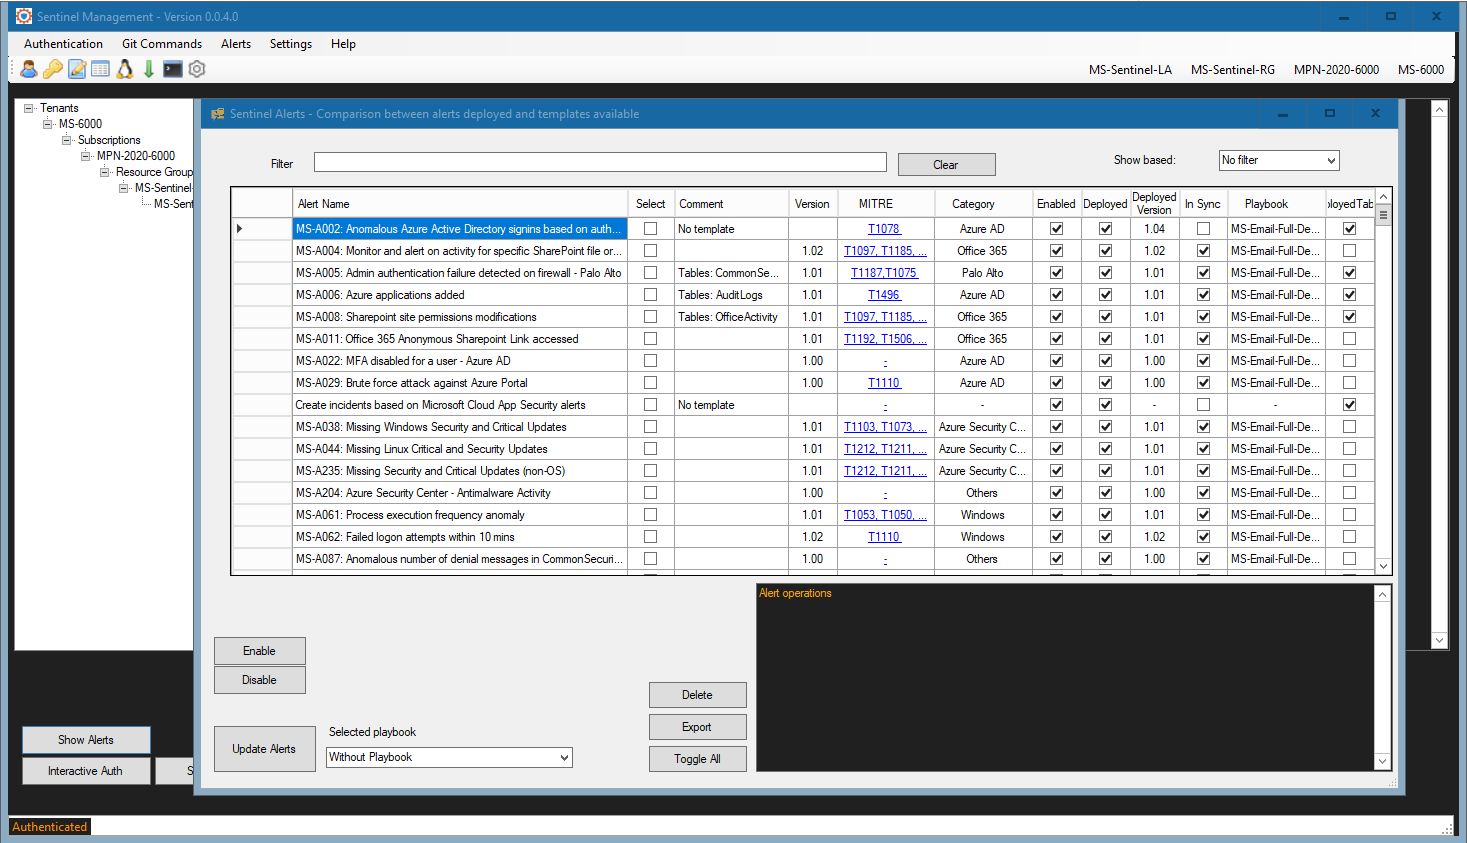
And since it was mentioned, here is a quick preview of the main interface for our Azure Sentinel Management (ASM) application. It provides integration with Managed Sentinel’s GitHub Azure Sentinel alerts repository (though the user will be able to add their own repository), alert versioning control, deployment automation for alerts and parsers, alert templates metadata for version, MITRE technique and log source category, exporting of alerts and other features that can assist a Sentinel administrator in managing the alerts effectively. We will publish a dedicated post on the ASM application in the near future.

